lists
Every list works the same way
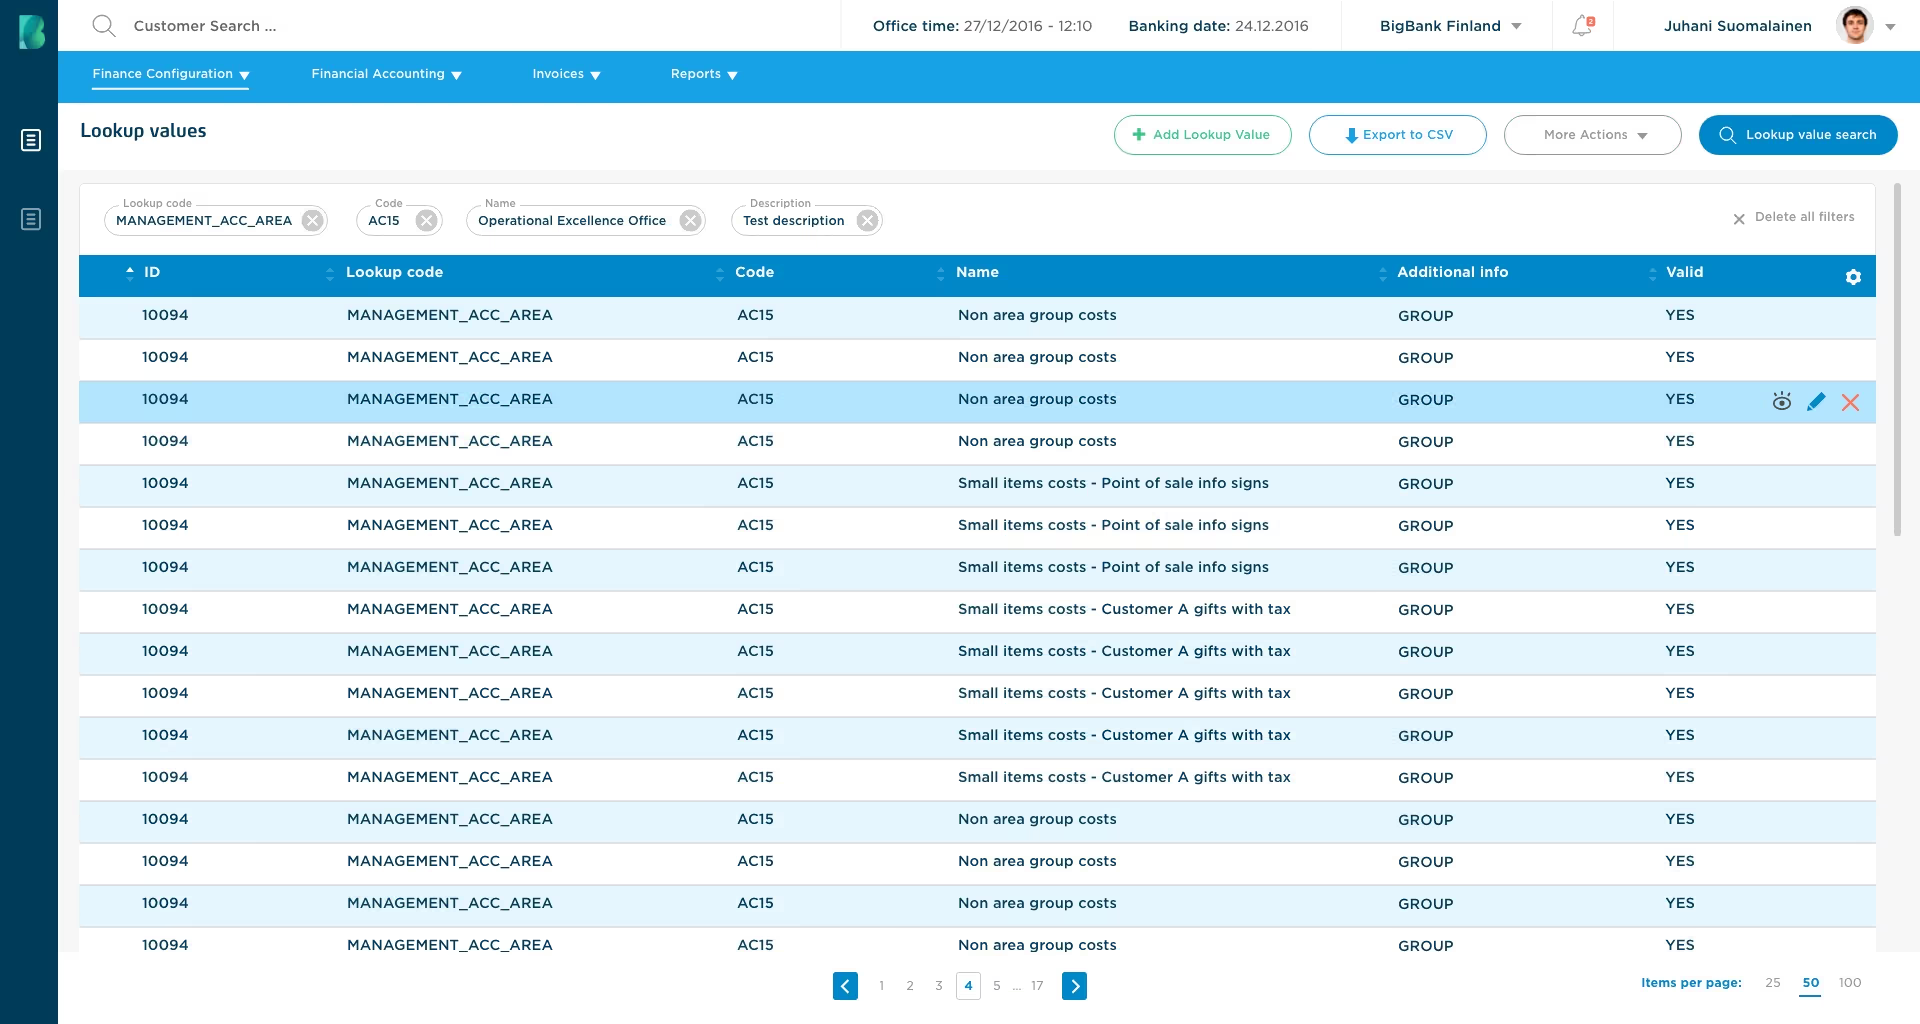
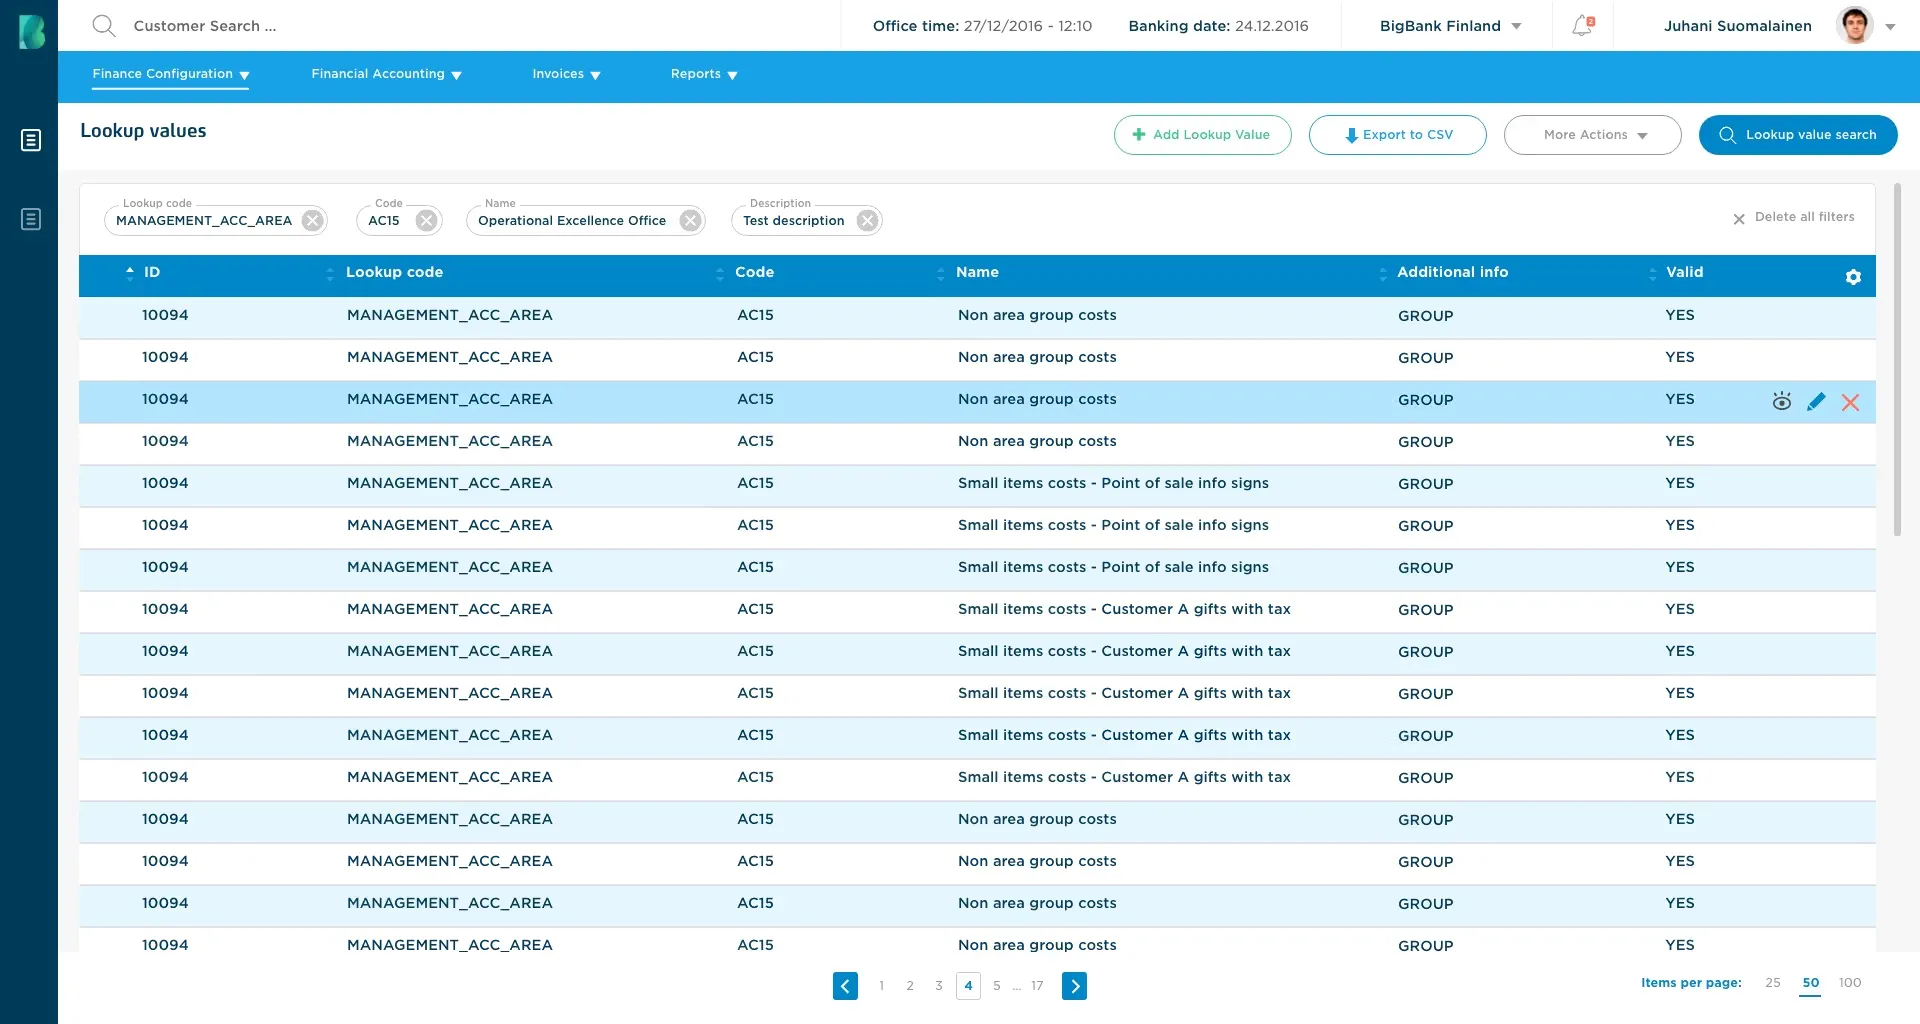
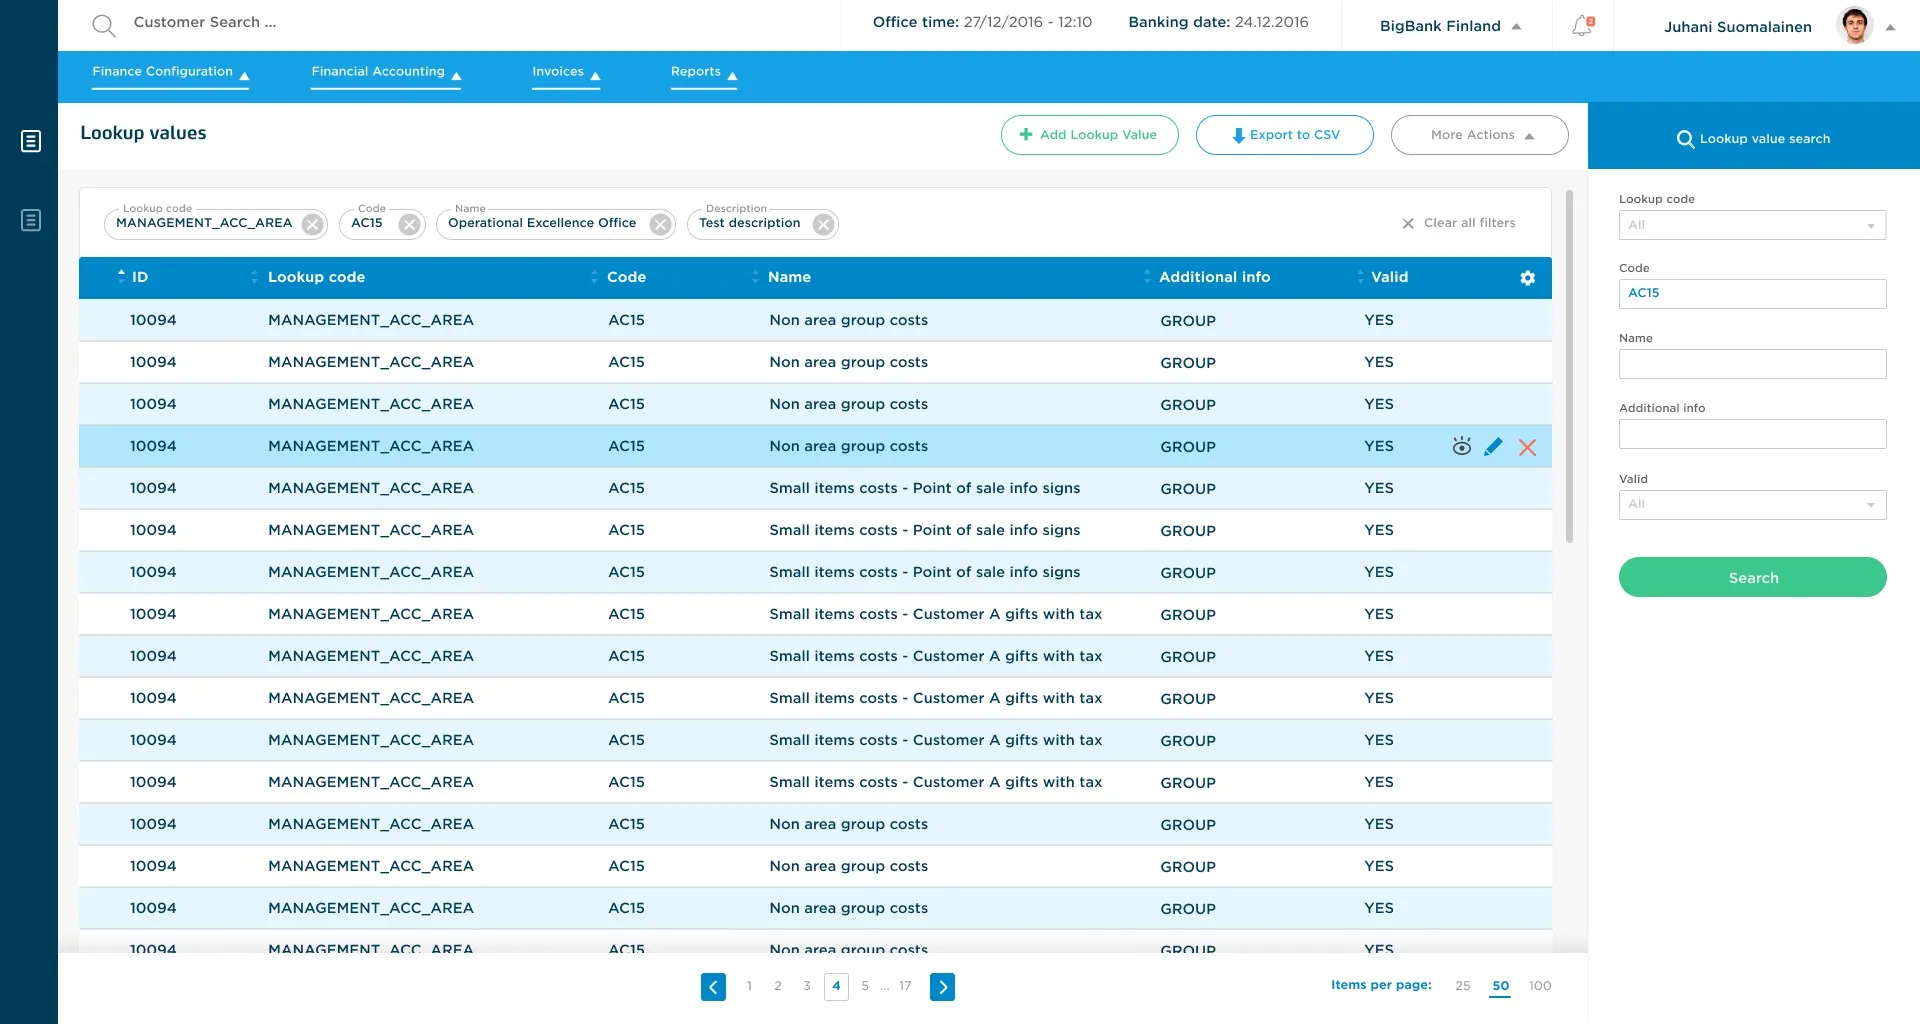
Lookup values, transactions and the other lists share one layout. Active filters show as chips above the table. Page actions are top right, row actions are on the selected row, and page numbers are at the bottom.
Bigbank · 2018 · internal tool
Bigbank's accountants used a generic third-party tool that was slow and hard to use. The goal was to build a Financial Back-office in-house and replace it. I studied the old system and designed the new one together with the accountants who use it.
problem
The accountants used a generic third-party tool. It had many features they did not use, and that made it slow and hard to use. They needed a system made for their work.
decision
Build it in-house. Design it with the accountants: talk to them often and get their feedback on new ideas early.
result
The new system went live. It shows the accountants the data they need, the way they want it.
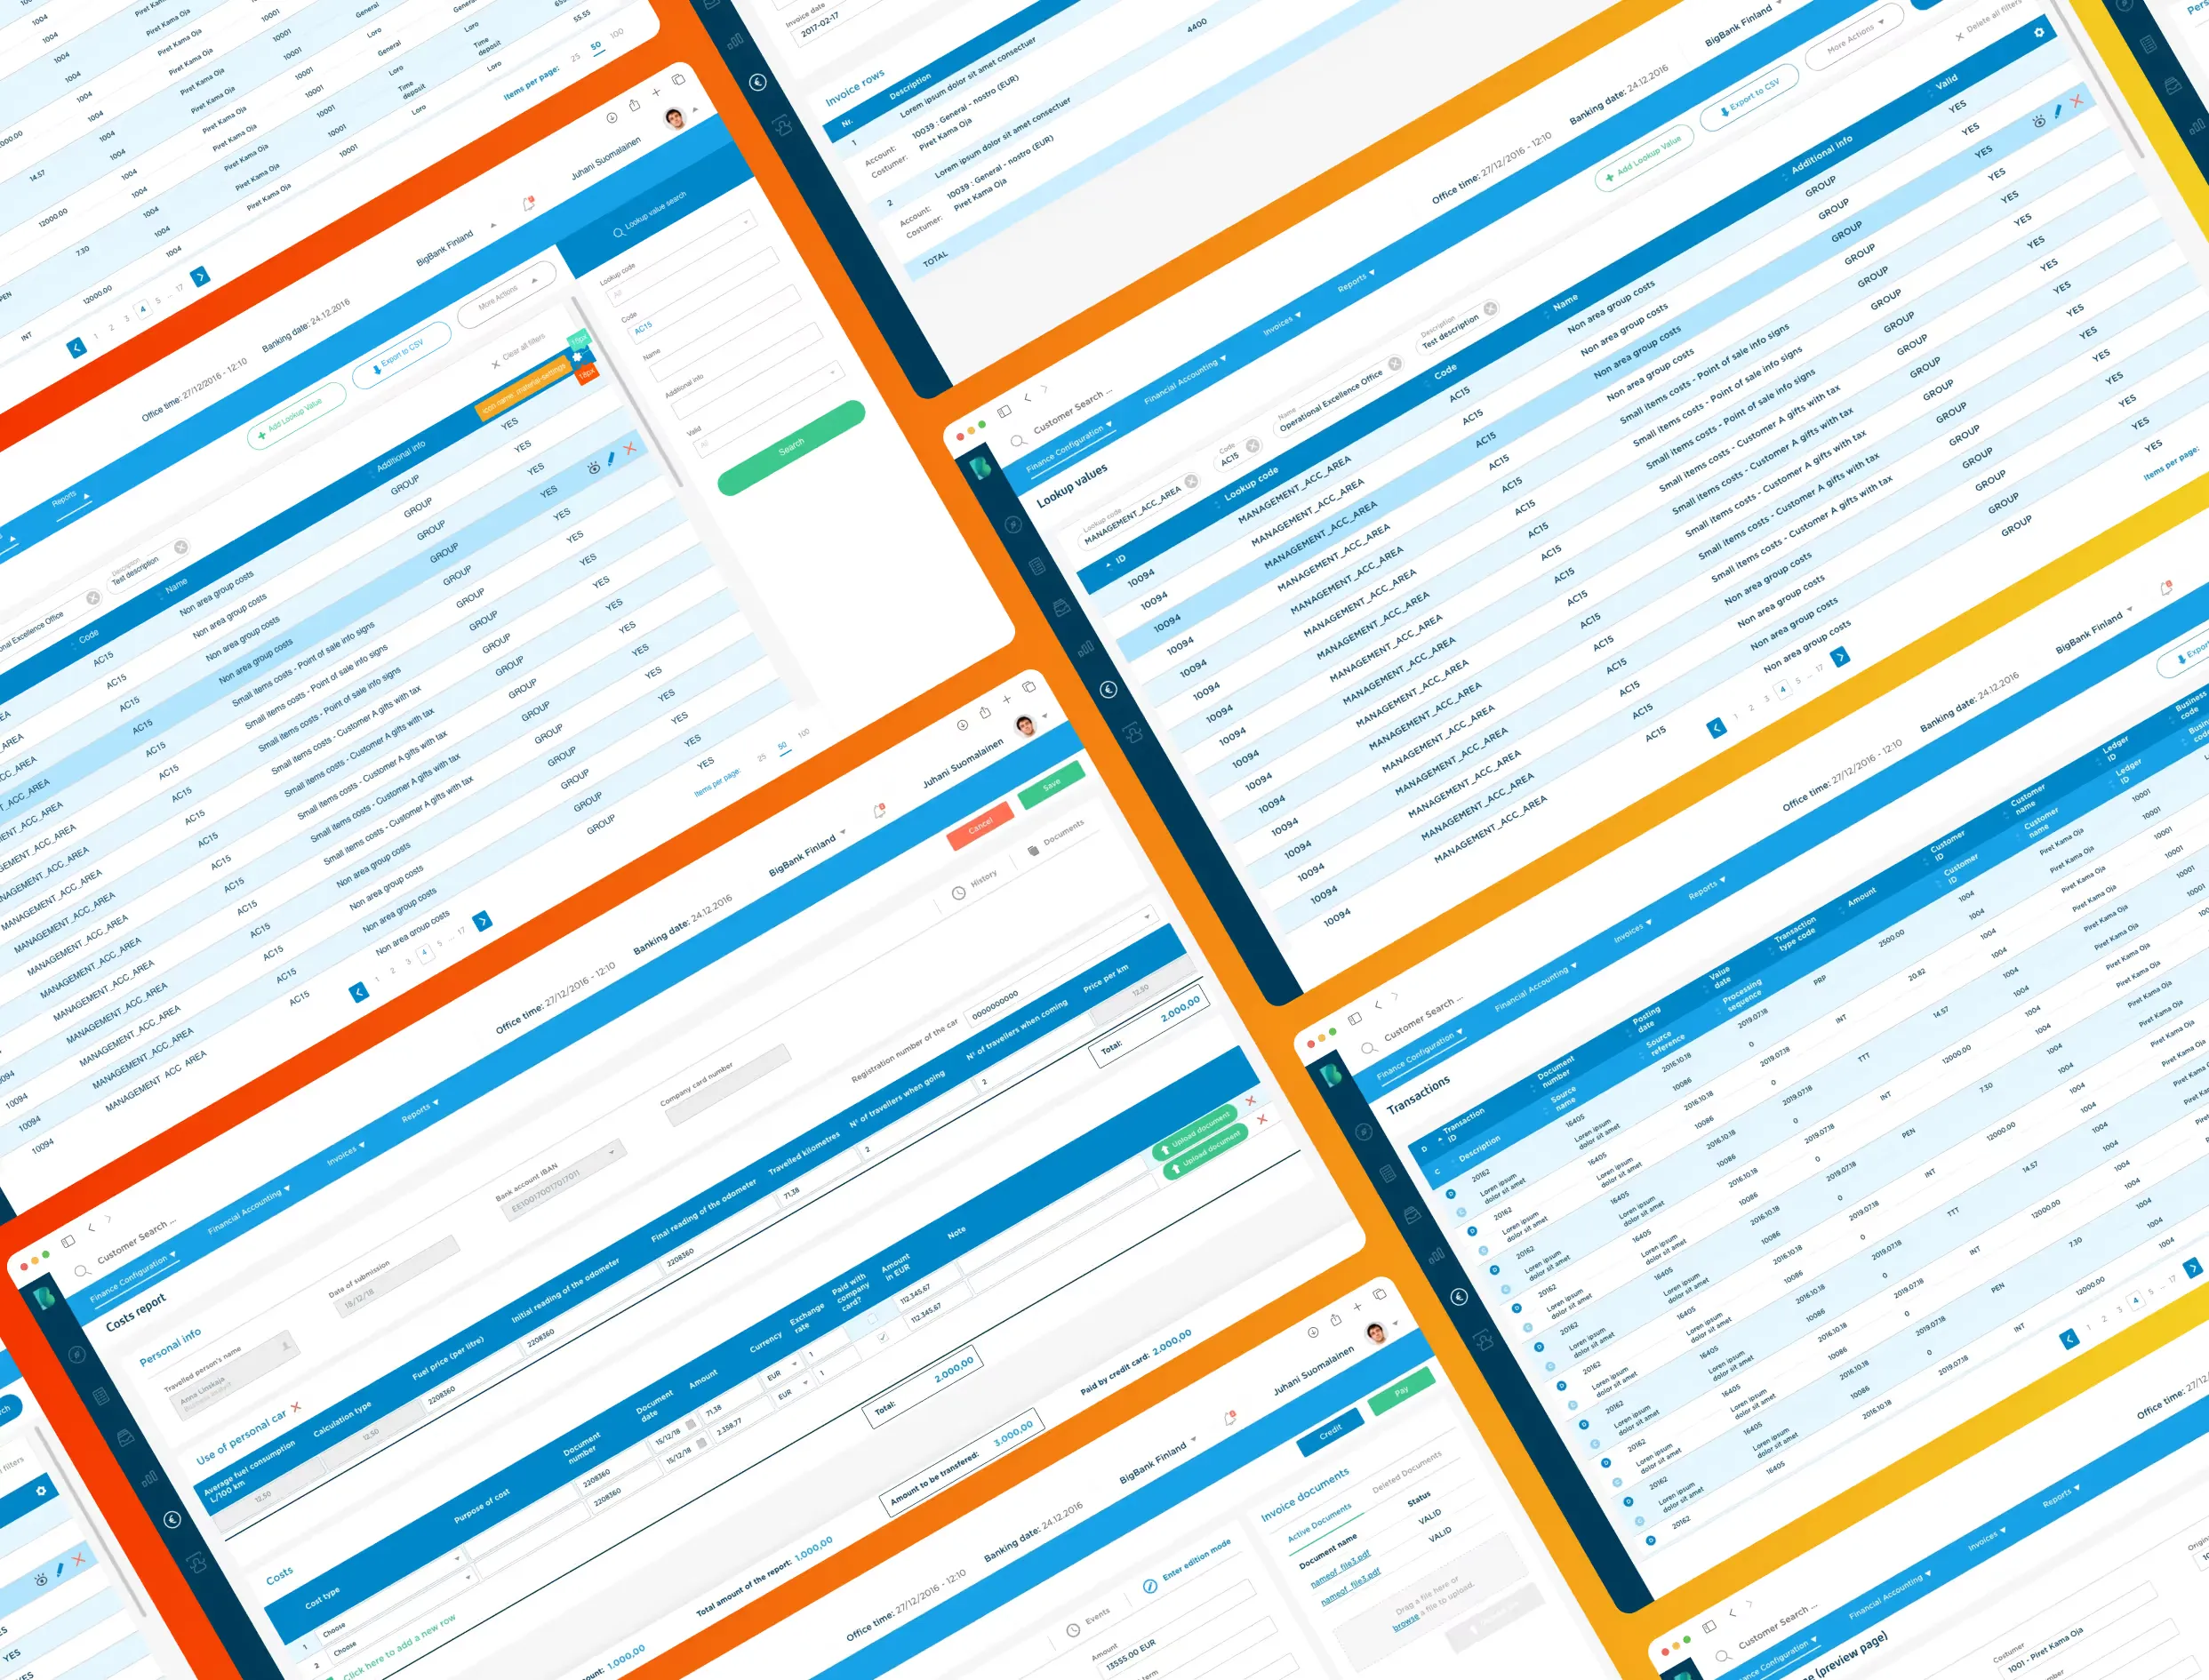
the main screens
lists
Lookup values, transactions and the other lists share one layout. Active filters show as chips above the table. Page actions are top right, row actions are on the selected row, and page numbers are at the bottom.
search
The search button opens a panel on the right. The accountants wanted to see all the data at once, so the panel never covers the table.
forms
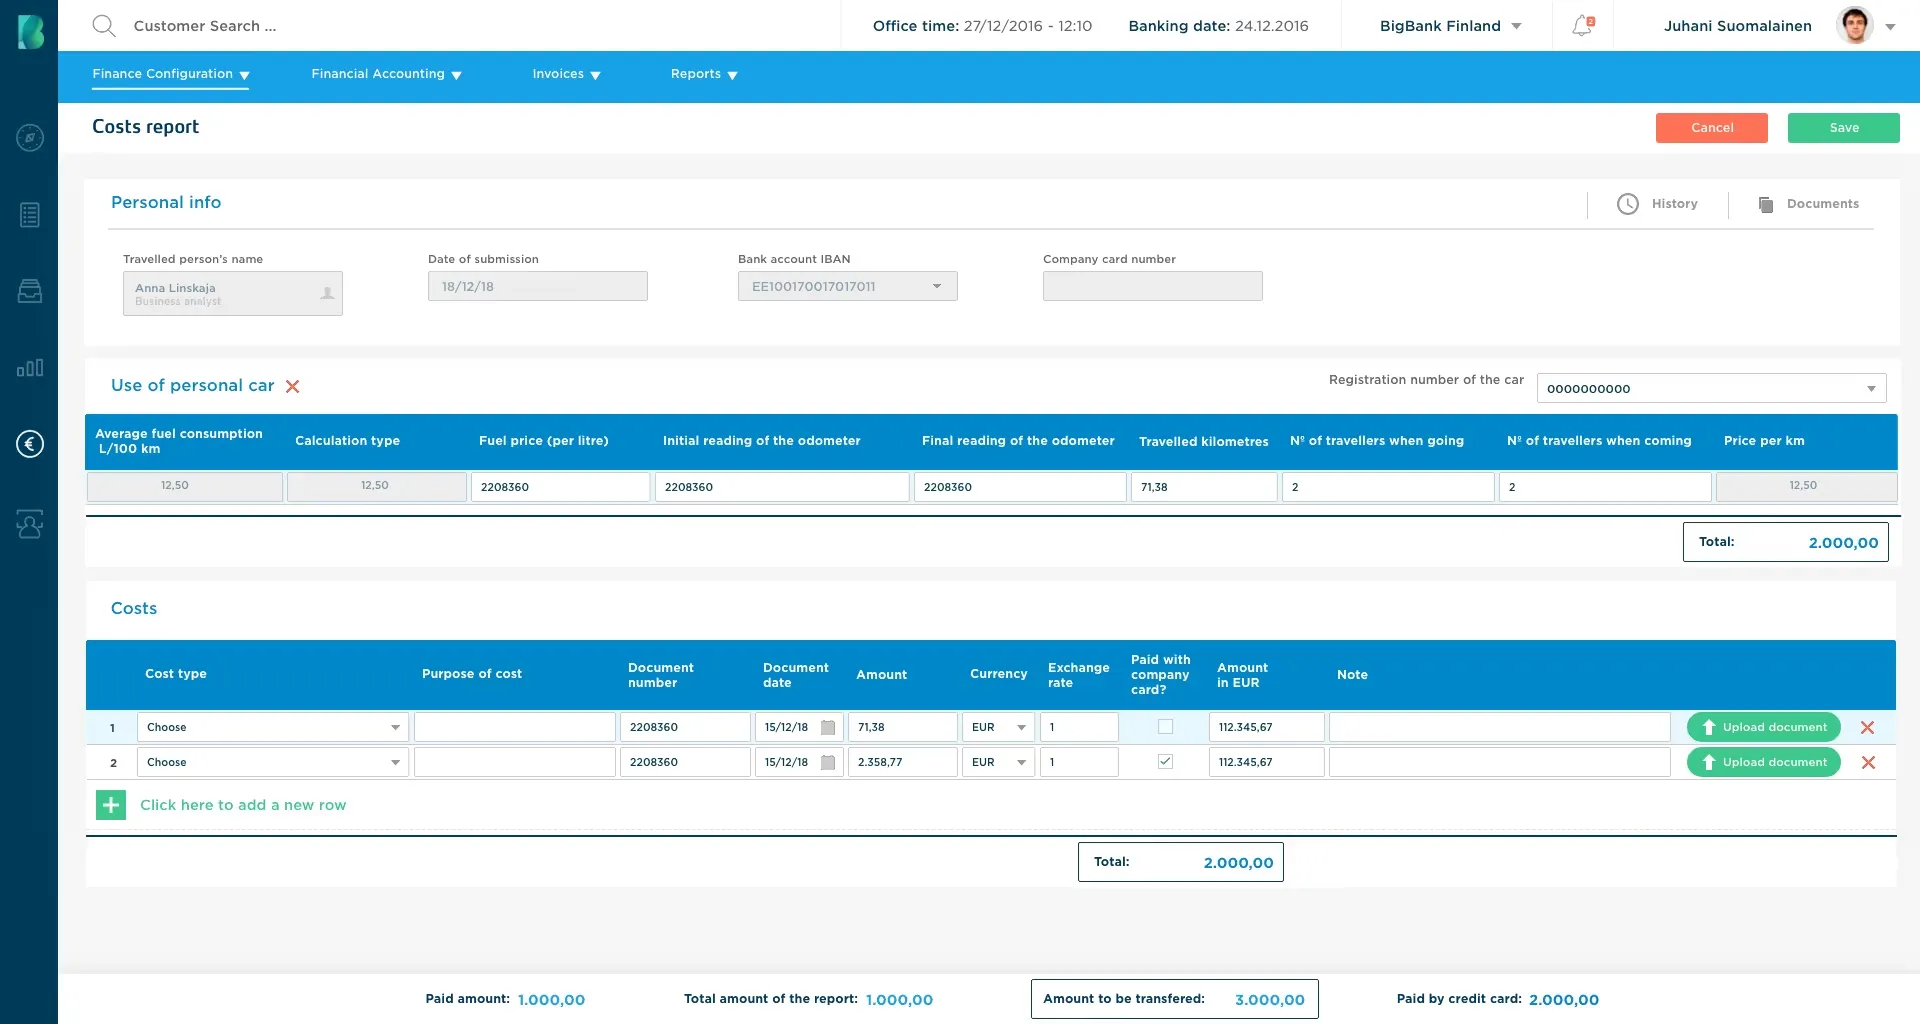
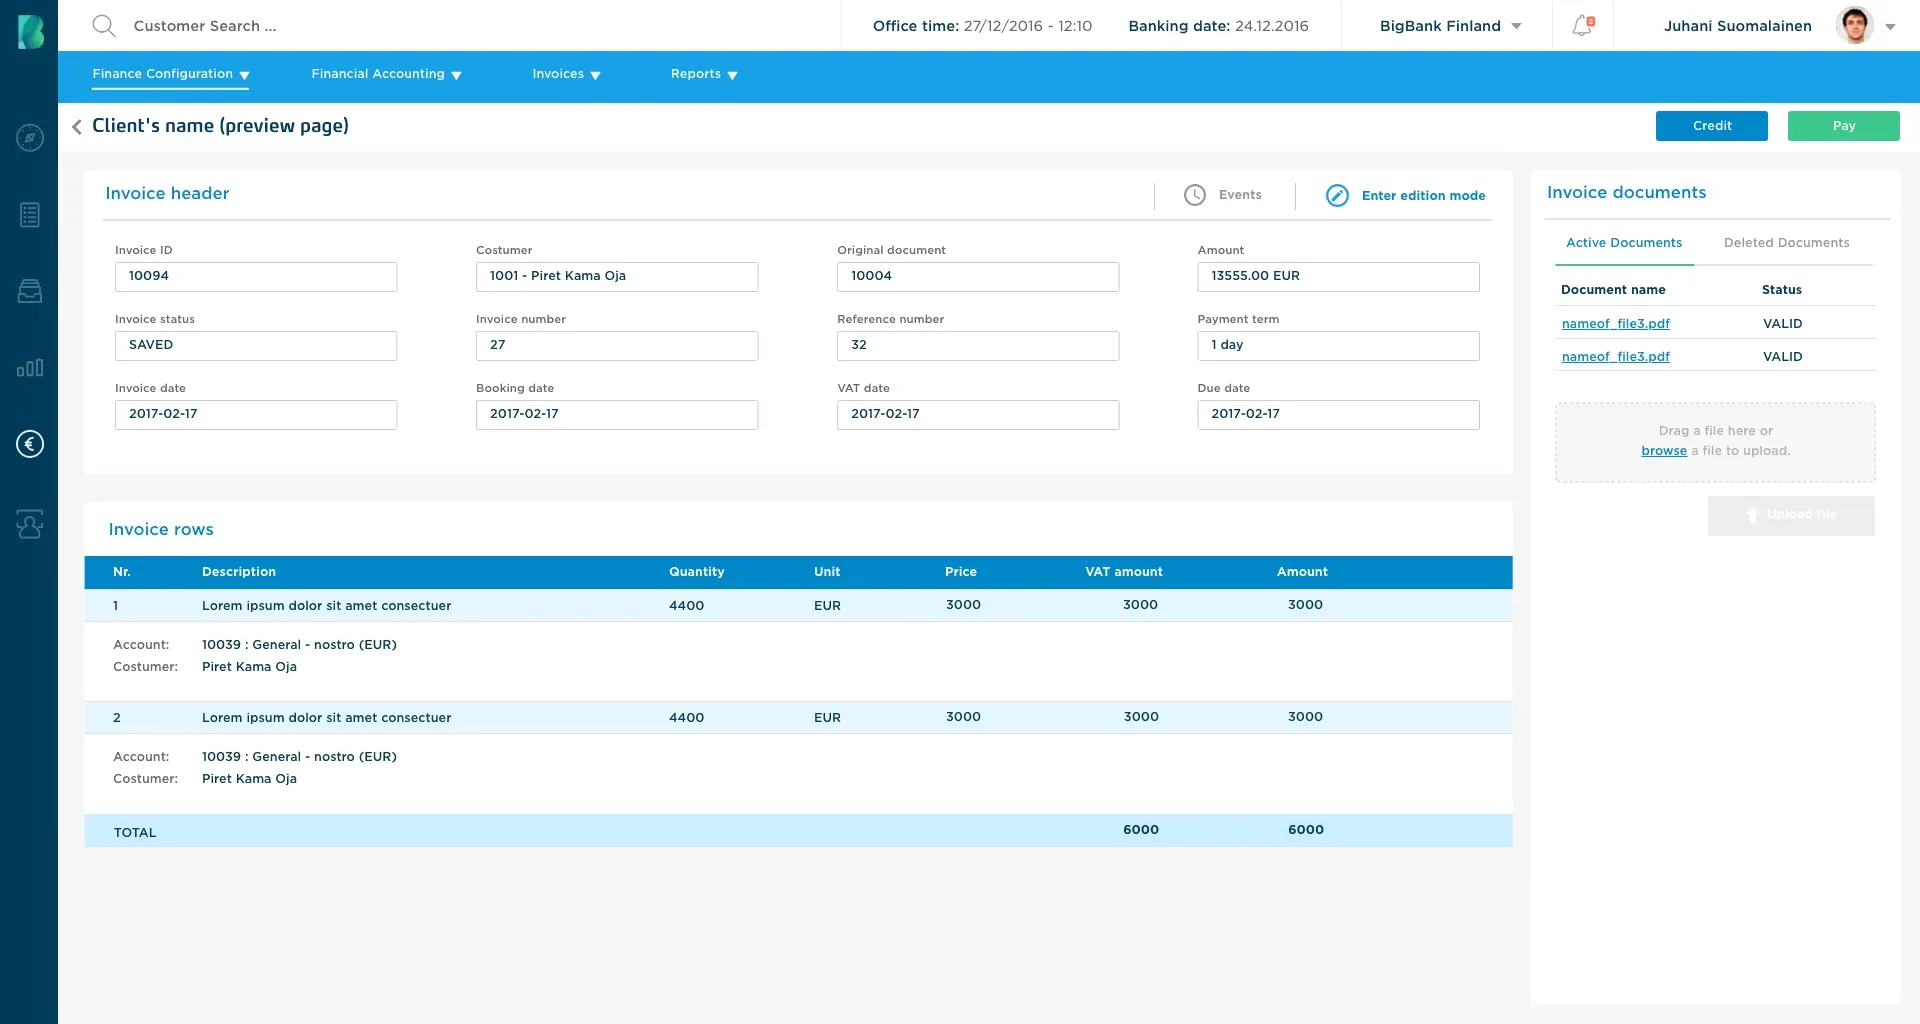
A cost report or an invoice has many fields. Each document is split into labelled groups. The totals and the main actions are always visible.
transactions
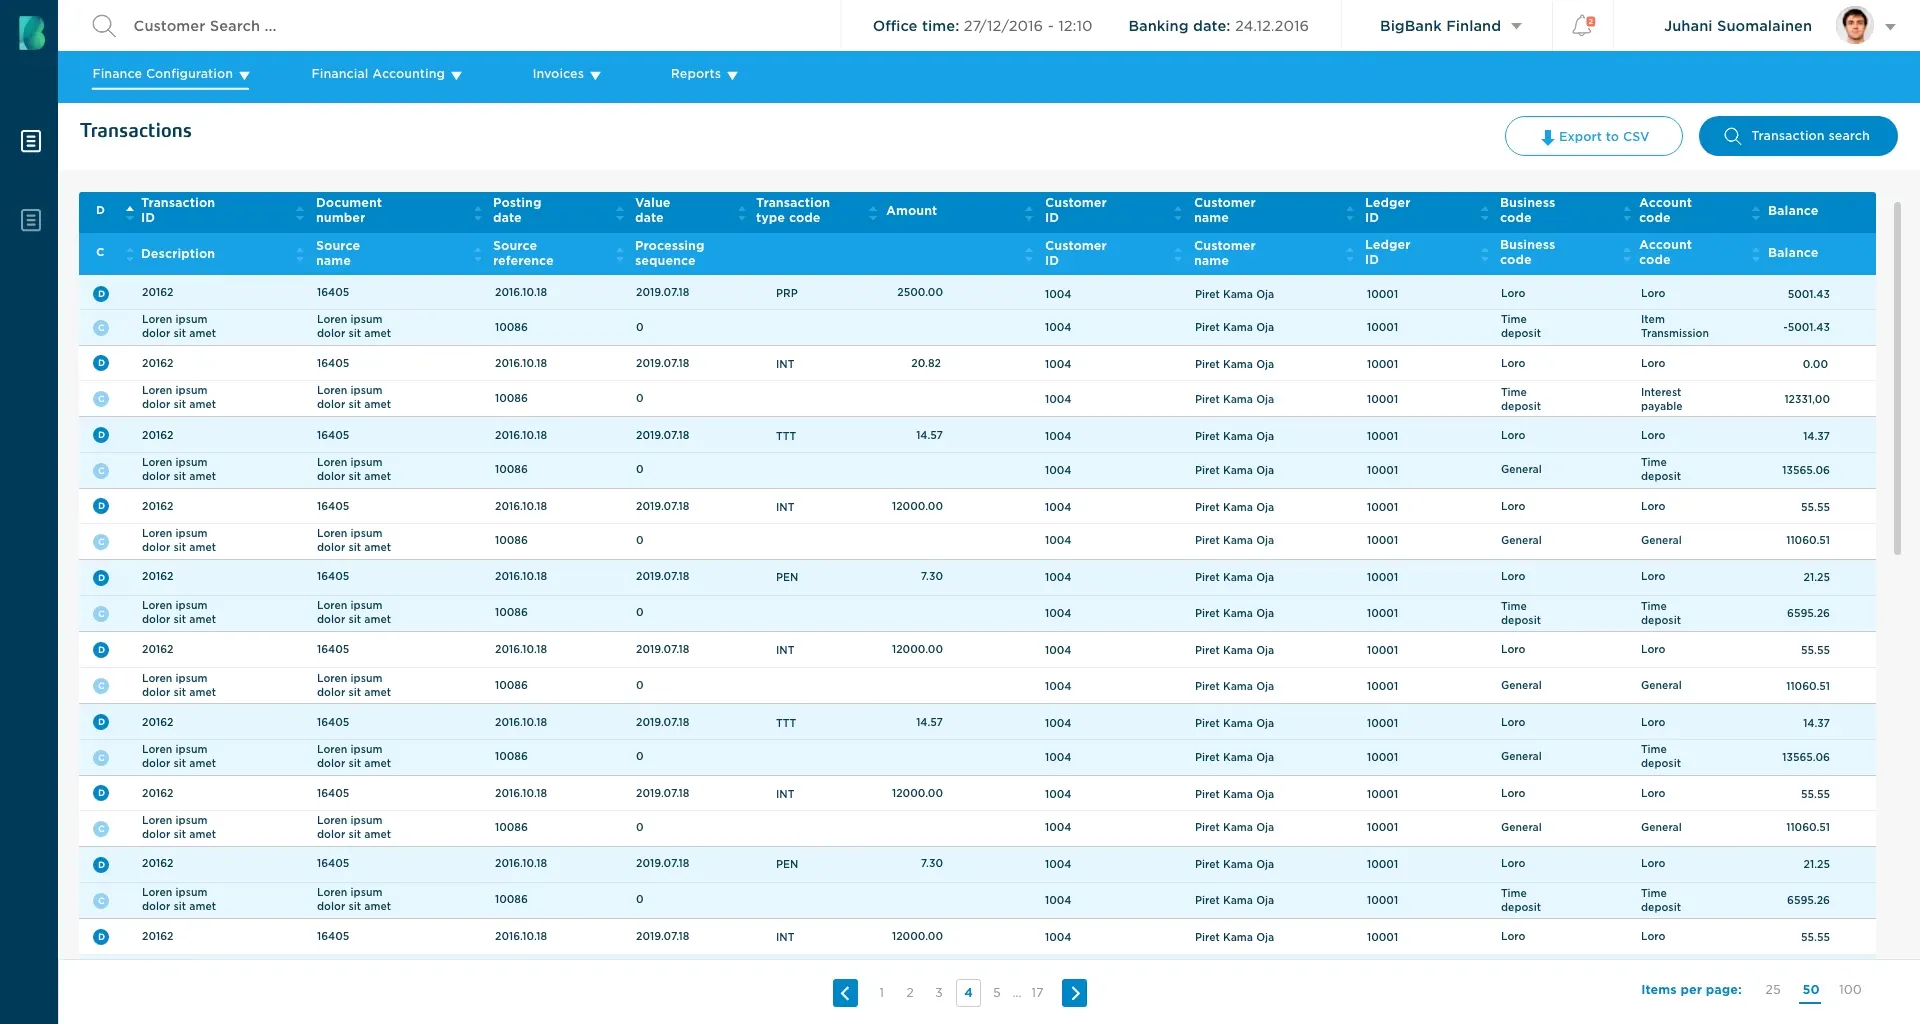
The accountants wanted as many rows on screen as possible, so the rows are compact. Each transaction takes two rows: D for debit and C for credit. Light and white bands separate one transaction from the next.
the process, short
team
I worked closely with developers, analysts and PMs. The users were our own accountants. We met them in person every week. They tested the new system step by step and got used to it. They also told us what should or should not be there.
the outcome, and what I learned
outcome
what I learned
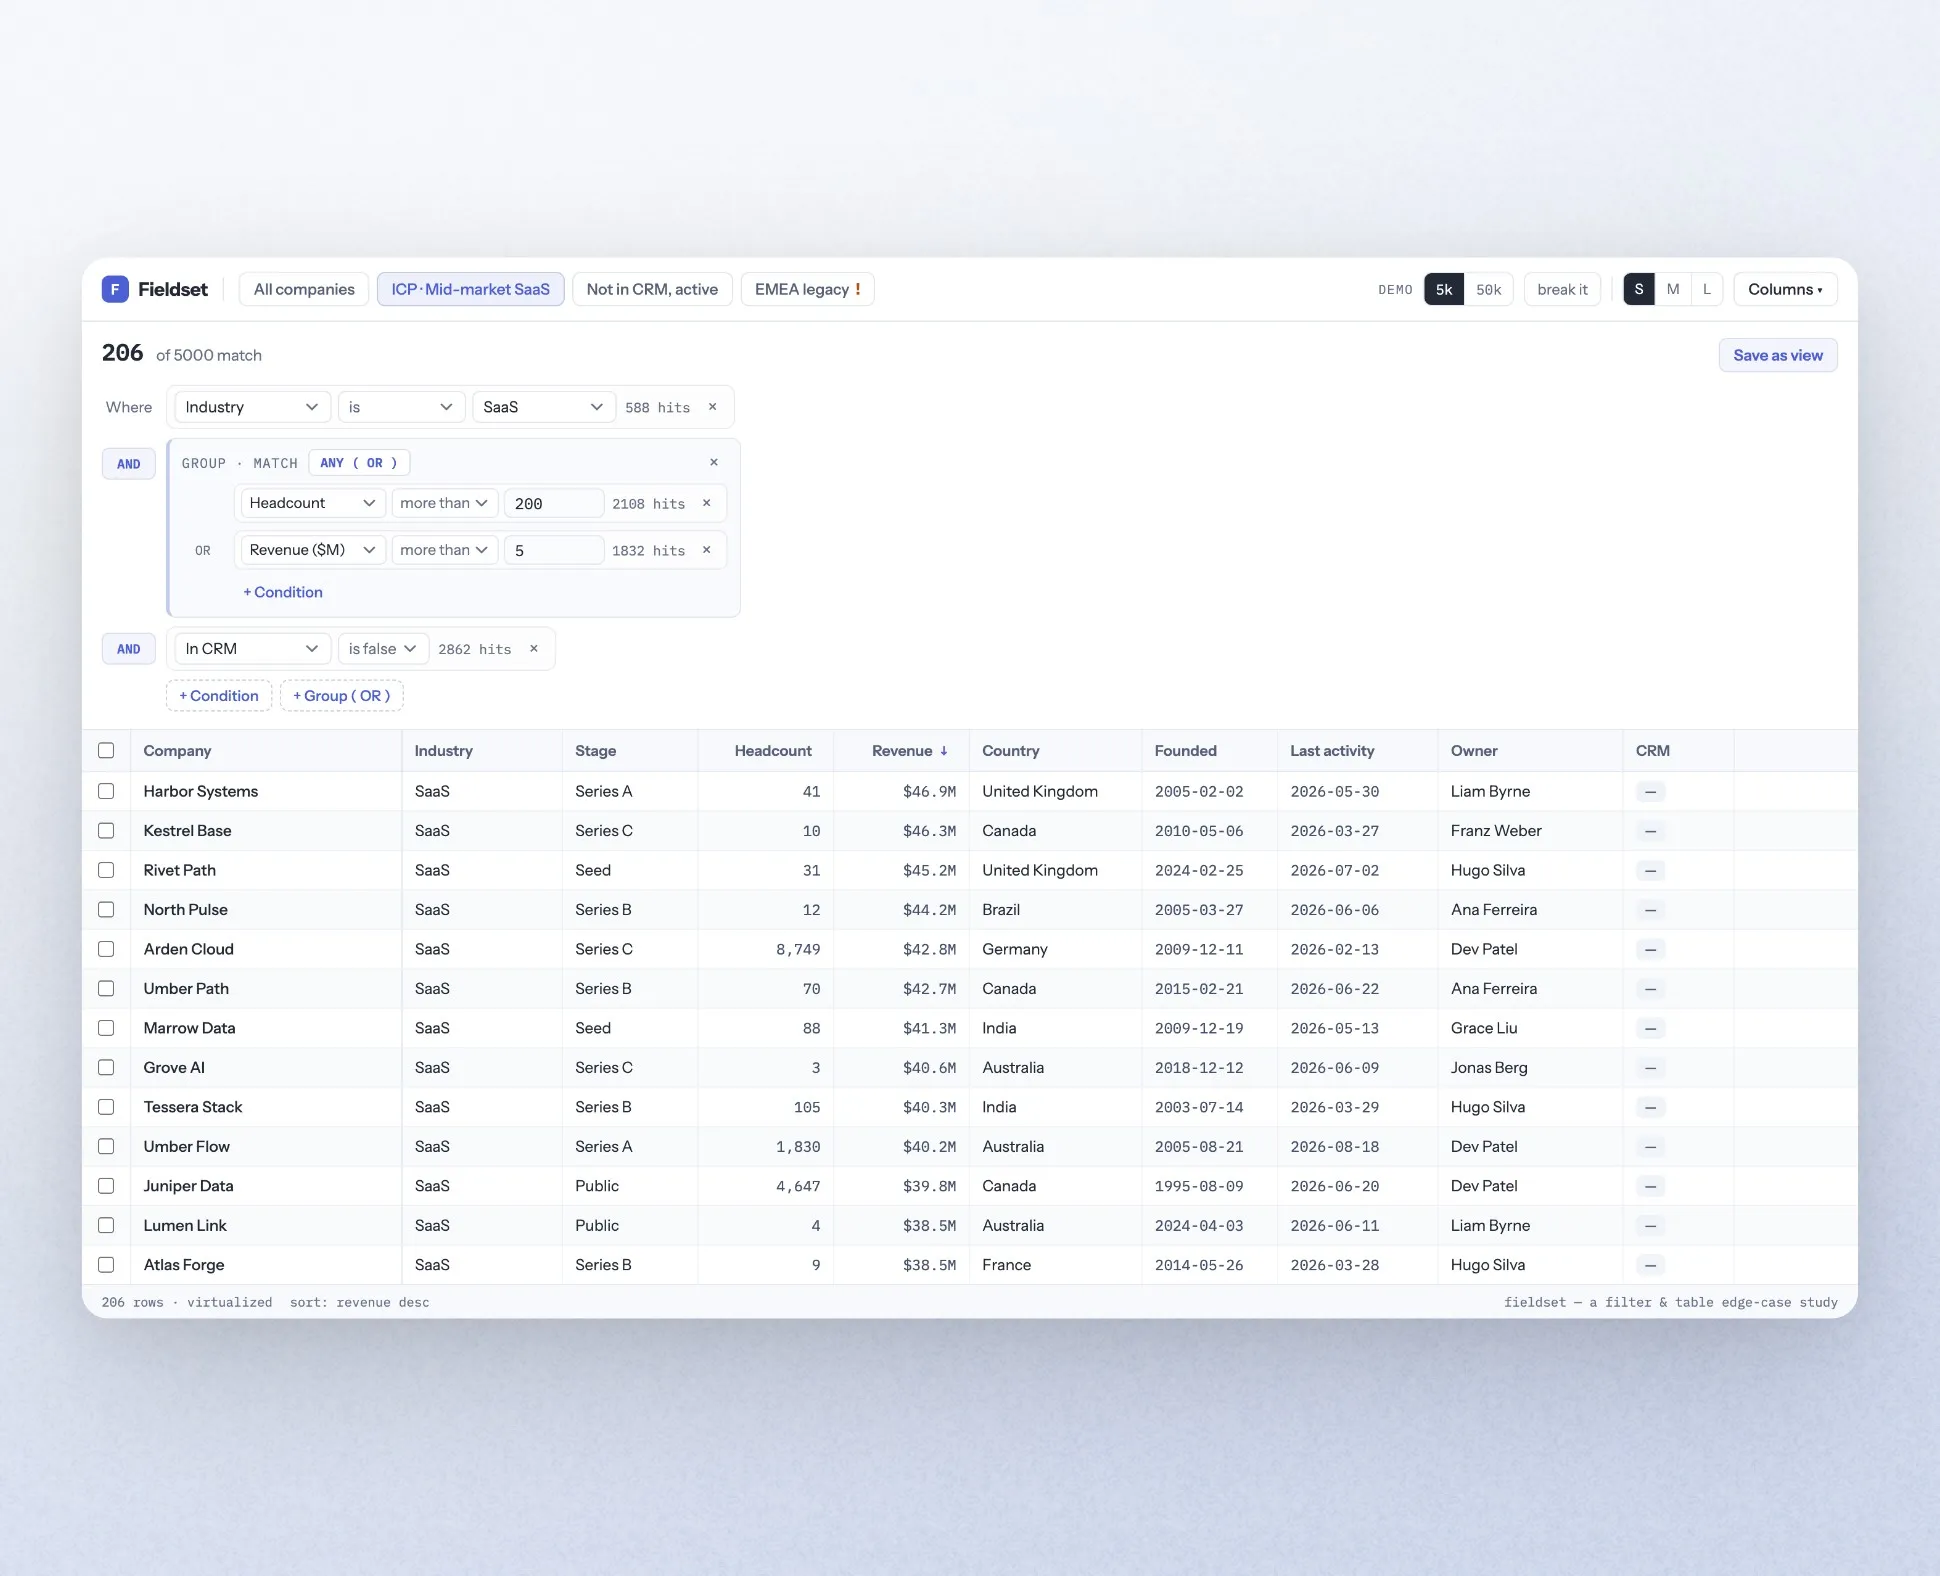
A filter builder over 50,000 rows. It keeps your edits, and it asks you before it changes what you selected.
Data data